

University and regional innovation analysis
Is your region turning research and talent into companies, jobs, and reinvestment?
Start with a locally tailored analysis from the university perspective. Then bring in the research office, tech transfer team, economic development partners, investors, and industry leaders who see the ecosystem from other angles. The Groundbreakers Ecosystem Navigator shows where their views align and where the path from research to regional value needs closer investigation.
AUTM benchmarks show what your institution produced. A shared ecosystem analysis shows whether the surrounding region can convert that research into companies, jobs, and reinvestment.
Start with your place
Run your first diagnostic in five minutes
Choose a place and your role. The questions are written around the institutions and conditions in that region.
The free report
What the questions and the report look like
Each question names the institutions in your region. The report gives a key finding, a score for each stage of the innovation cycle, and recommended actions written for research and tech transfer leaders.
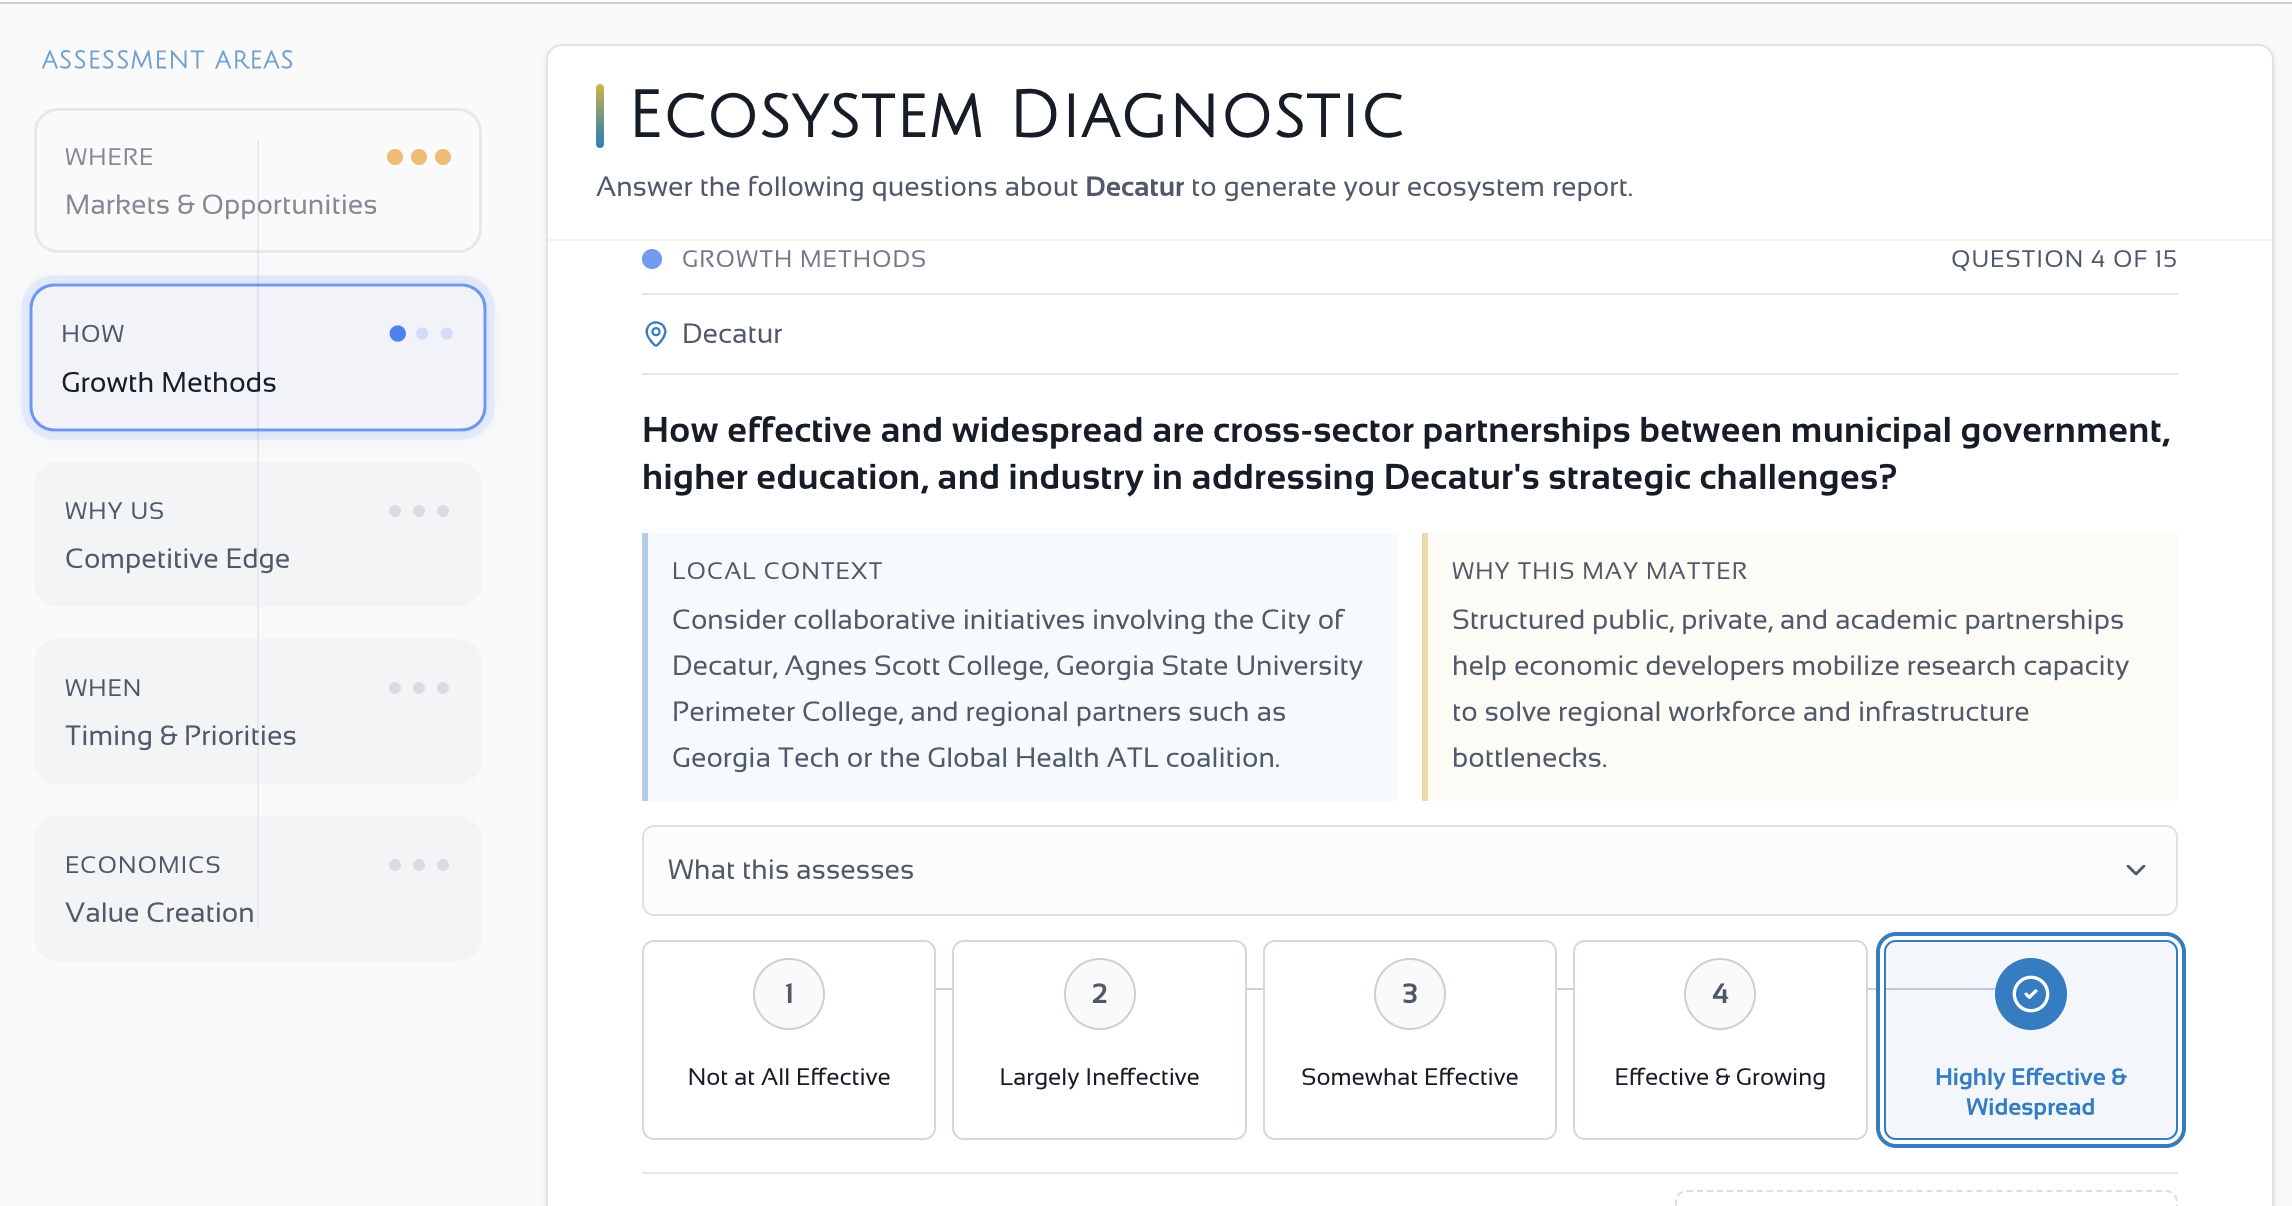
A question, written for one place
Decatur, Georgia. The question names the City of Decatur, Agnes Scott College, Georgia State University Perimeter College, and Georgia Tech.
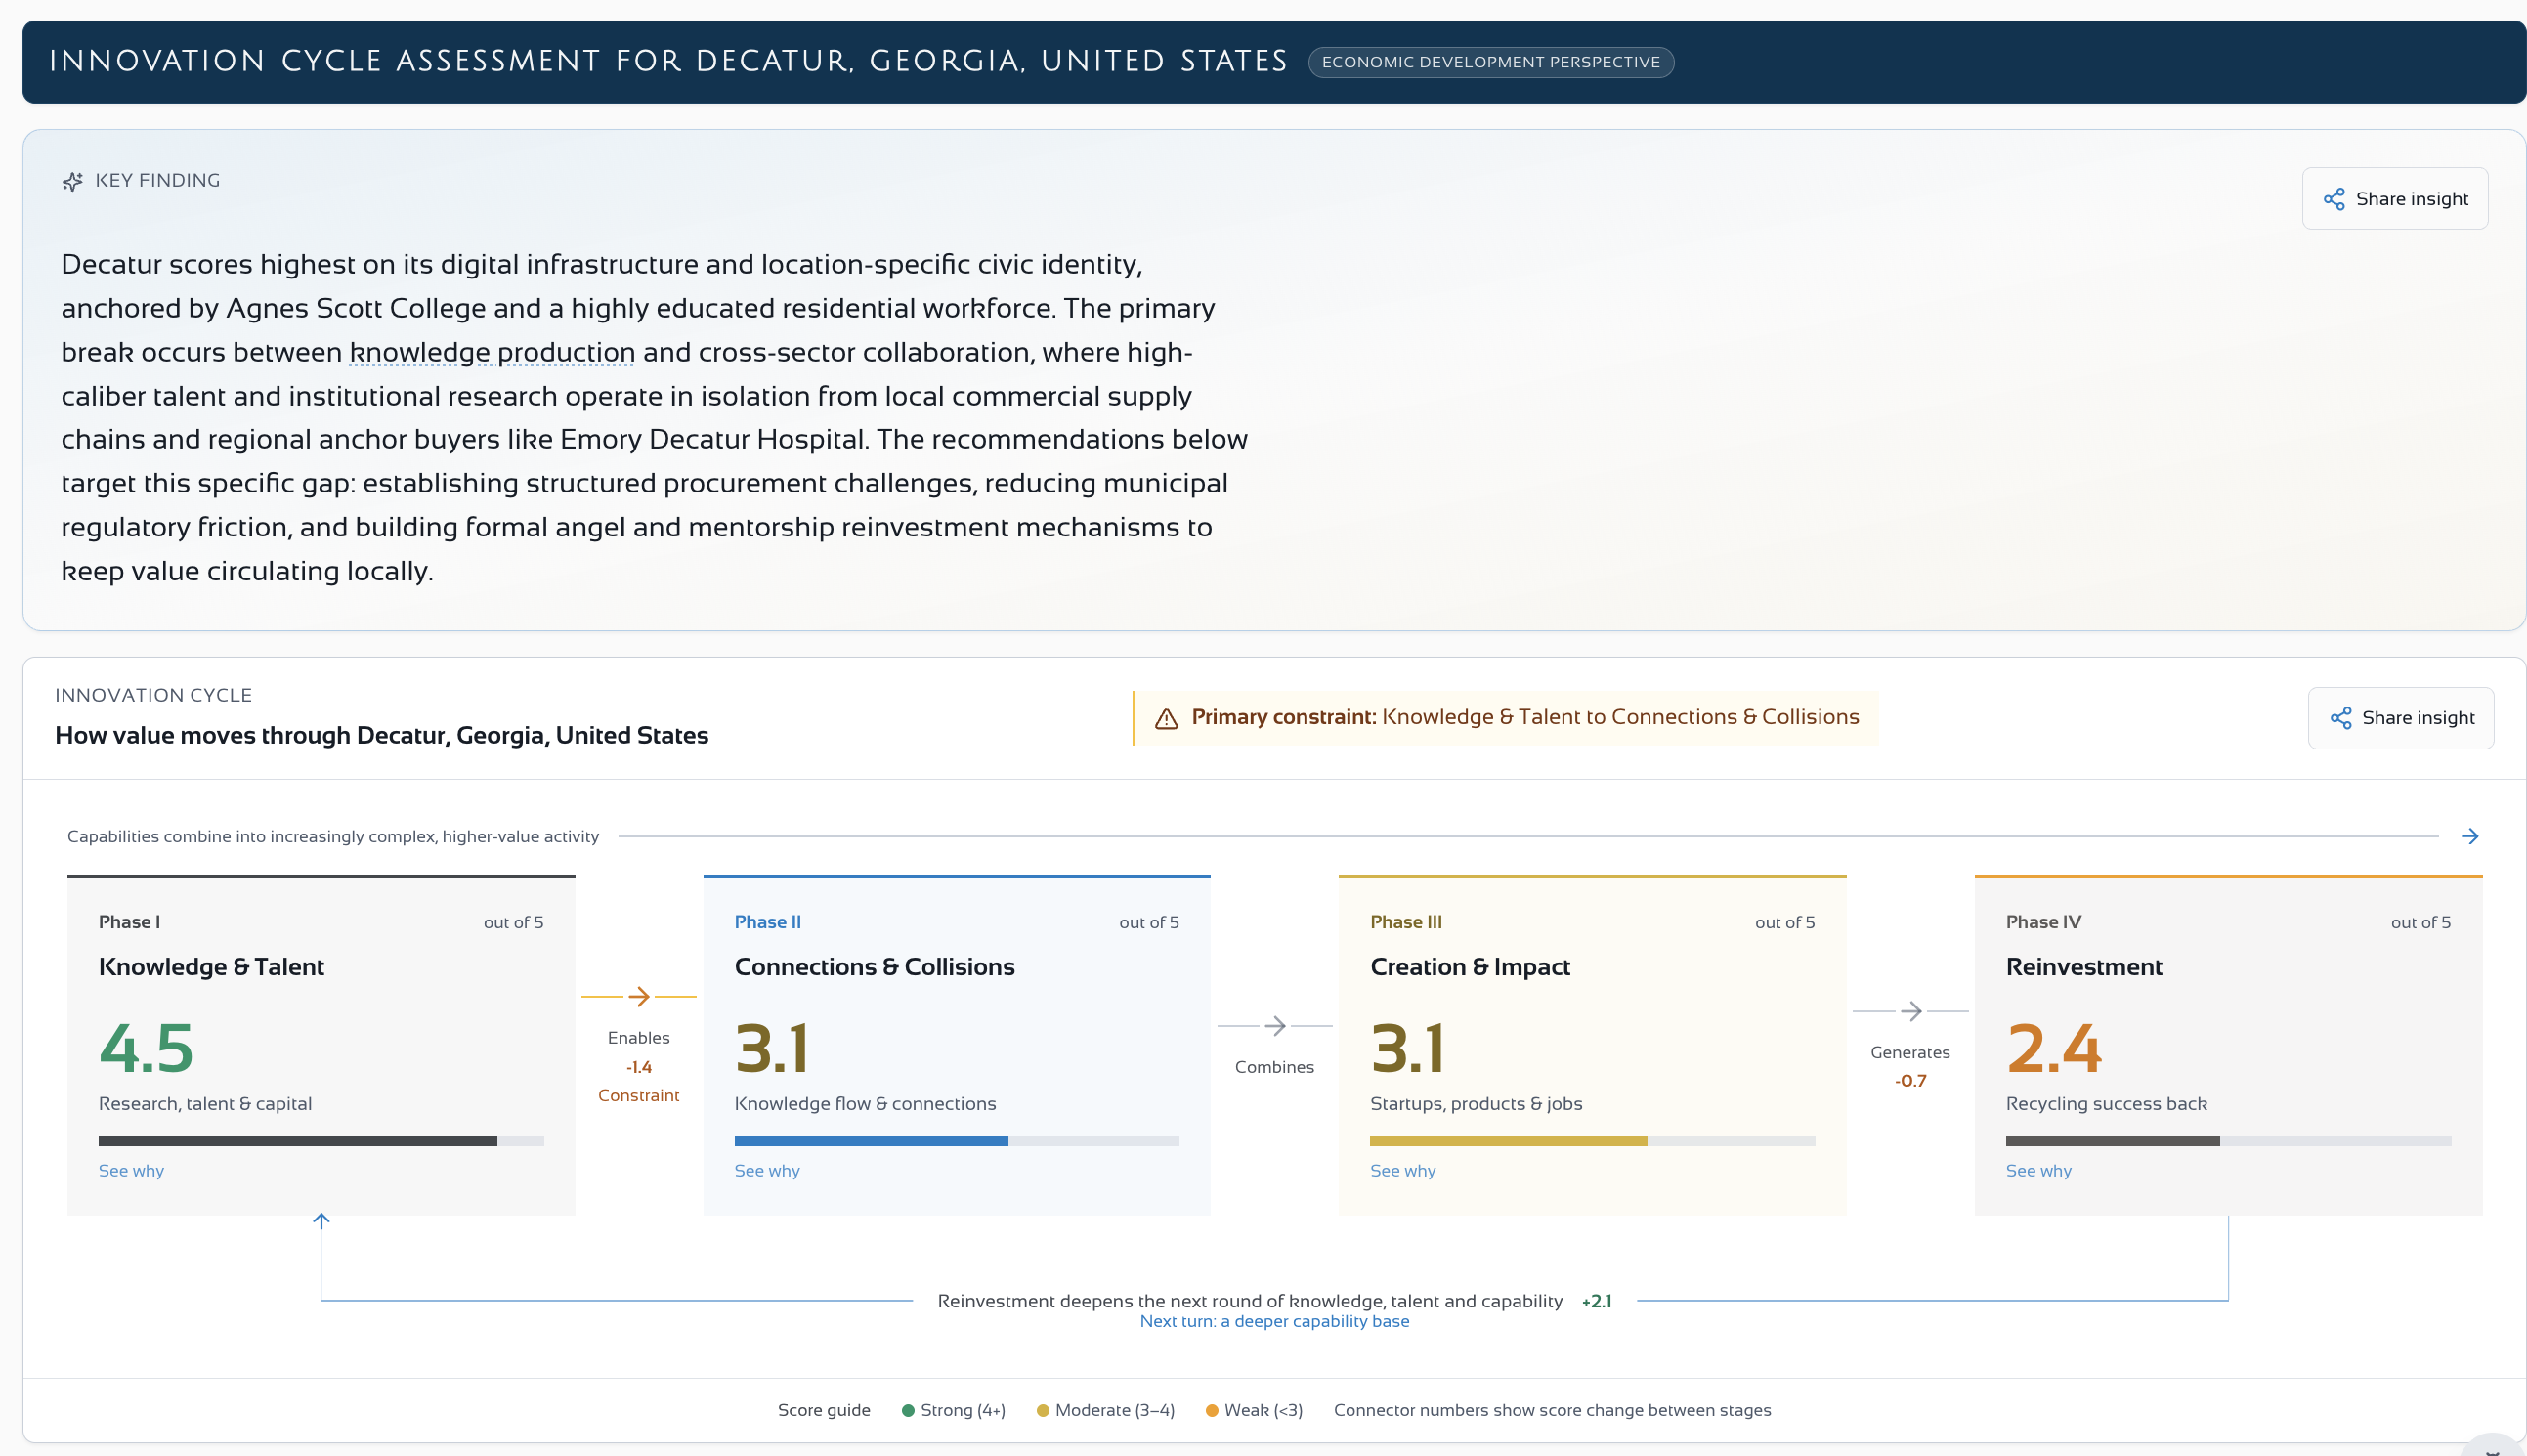
Key finding and cycle scores
The report names the stage where value stops moving and says why.
Common questions from research and tech transfer leaders
Four questions research VPs and TTO directors ask about their region, and what the diagnostic can tell you about each one.
"Our disclosures are up, but spinoffs aren't."
The diagnostic shows where the handoff breaks between your TTO, local capital, and the ability of local industry to take up new research. It is usually not the TTO.
"We produce great graduates. They leave."
When graduates leave, it usually means the local economy does not have the kind of knowledge-intensive employers that keep them. The diagnostic measures that gap.
"Industry doesn't engage with our research."
The diagnostic rates how well knowledge moves out of the institution. Do local firms know what you offer? Is the TTO set up for applied collaboration, or only for licensing?
"The provost wants proof of economic impact."
Annual reports count patents and licenses. The diagnostic scores your institution's role in the regional innovation cycle, which is where the economic impact actually shows up.
Group diagnostics
Compare how different people rate the same ecosystem
The university research and innovation view is one part of the picture. Ecosystem Navigator collects it alongside the people who work in the same ecosystem from other roles, then shows the group where they agree, where they differ, and what to look into next.
Diagnose
Run a locally tailored diagnostic from your own role. The free version is 10 questions and takes about five minutes.
Compare
Invite people who work in the ecosystem from other roles, then see where their responses agree and where they differ.
Decide and measure
Investigate the evidence, share clear priorities, and repeat the same exercise to make change visible over time.
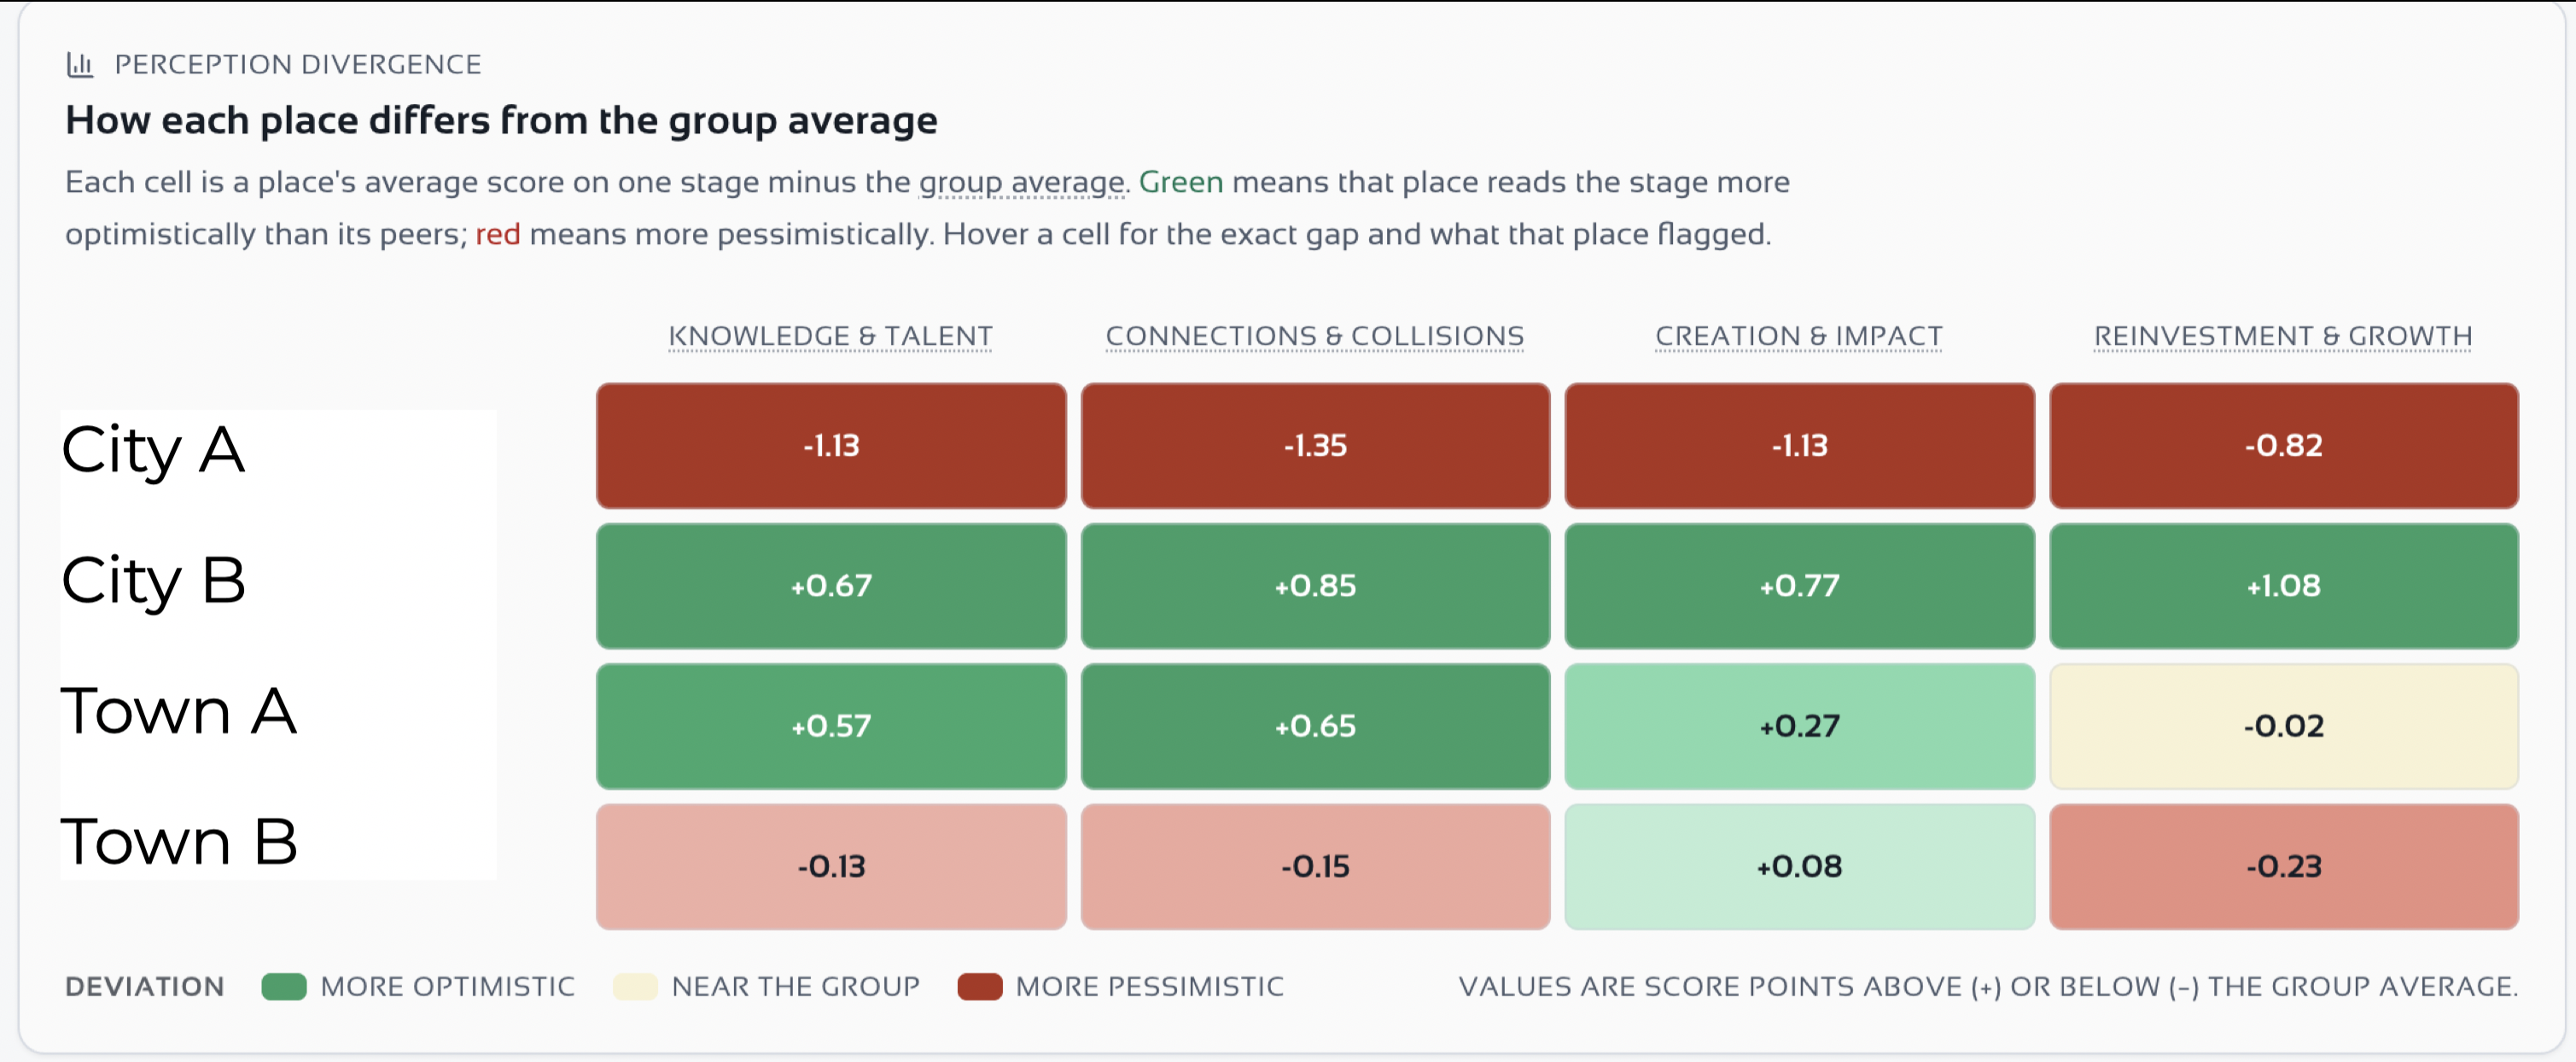
Difference from the group average
Group results in Pro. Each row shows where one place or participant rates higher or lower than the rest of the group.
What the platform gives you
A single report clarifies your institution's role. Group diagnostics show whether the surrounding ecosystem sees the same constraints.
A scored baseline for your region
Scores for how research, talent, capital, and commercialization paths connect around your institution.
Group diagnostics
Invite research, tech transfer, economic development, industry, and investor voices to answer the same questions.
Evidence base
Each run adds answers, scores, assets, recommendations, and citations to a record of how the university-region ecosystem is changing.
Reports for the provost and board
PDF export, share links, stakeholder briefs, and actions written for university leaders and partners.
What happens to research after it leaves the institution
AUTM metrics tell you what your office produced. The diagnostic tells you whether the ecosystem around you is turning it into economic value.
- Disclosures filed: 47
- Licenses executed: 12
- Startups formed: 3
- Licensing revenue: $1.2M
- “Local firms rate awareness of your research a 2.1/5. The constraint is not your TTO. Local SMEs have little capacity to take up new research.”
- “Knowledge and talent averages 4.2 of 5, while connections averages 2.4. Respondents see a weaker handoff from research to the market.”
- “Three accelerators within 30km are not connected to your research output. Consider...”
Questions from research leaders
I'm a VP Research, not an economic developer. Is this for me?▾
Will the questions make sense for a university context?▾
Can I use this report in presentations to the provost or board?▾
What makes this more than a general regional summary?▾
What does the free version include?▾
Can multiple people at my institution run the diagnostic?▾
Run the free diagnostic for your region
Ten questions about your region. A report on whether the ecosystem around your research is keeping up with it.
10 questions · About 5 minutes · No account required