

Inclusive regional innovation analysis
Is regional growth reaching the communities you serve?
Start with a locally tailored analysis from the perspective of the communities you serve. Then compare it with what government, economic development, universities, funders, and community partners see across the ecosystem. The Groundbreakers Ecosystem Navigator turns those vantage points into shared evidence for funding, convening, and advocacy.
Impact reports measure individual programs. A shared ecosystem analysis shows whether the surrounding institutions include the people they claim to serve and where partners understand the gap differently.
Start with your place
Run your first diagnostic in five minutes
Choose a place and your role. The questions are written around the institutions and conditions in that region.
The free report
What the questions and the report look like
Each question names the institutions in your region. The report gives a key finding, a score for each stage of the innovation cycle, and recommended actions written for foundations and NGOs.
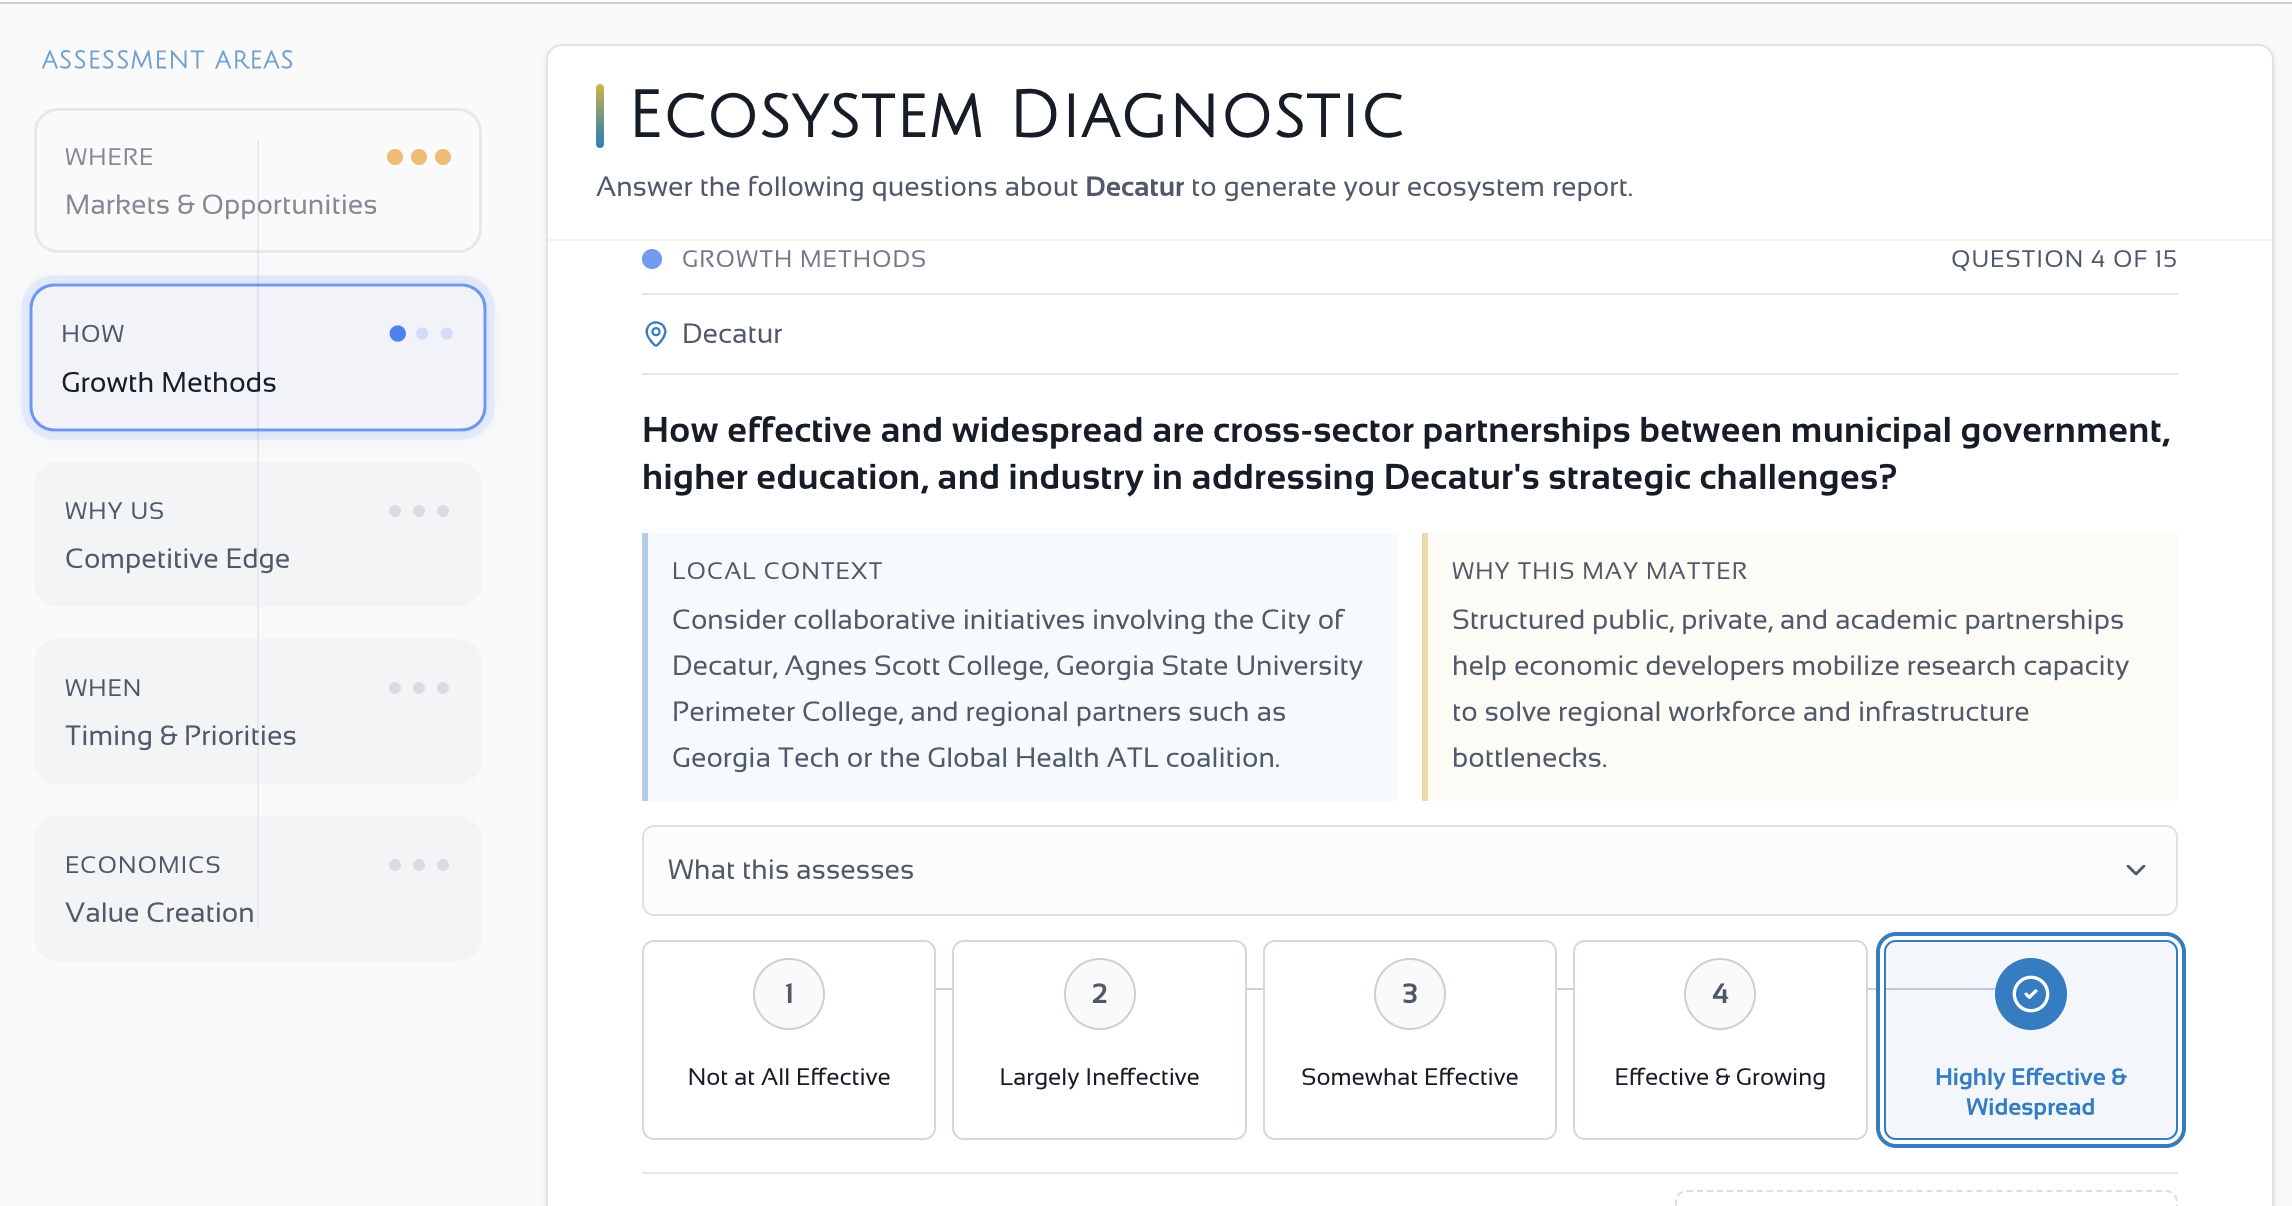
A question, written for one place
Decatur, Georgia. The question names the City of Decatur, Agnes Scott College, Georgia State University Perimeter College, and Georgia Tech.
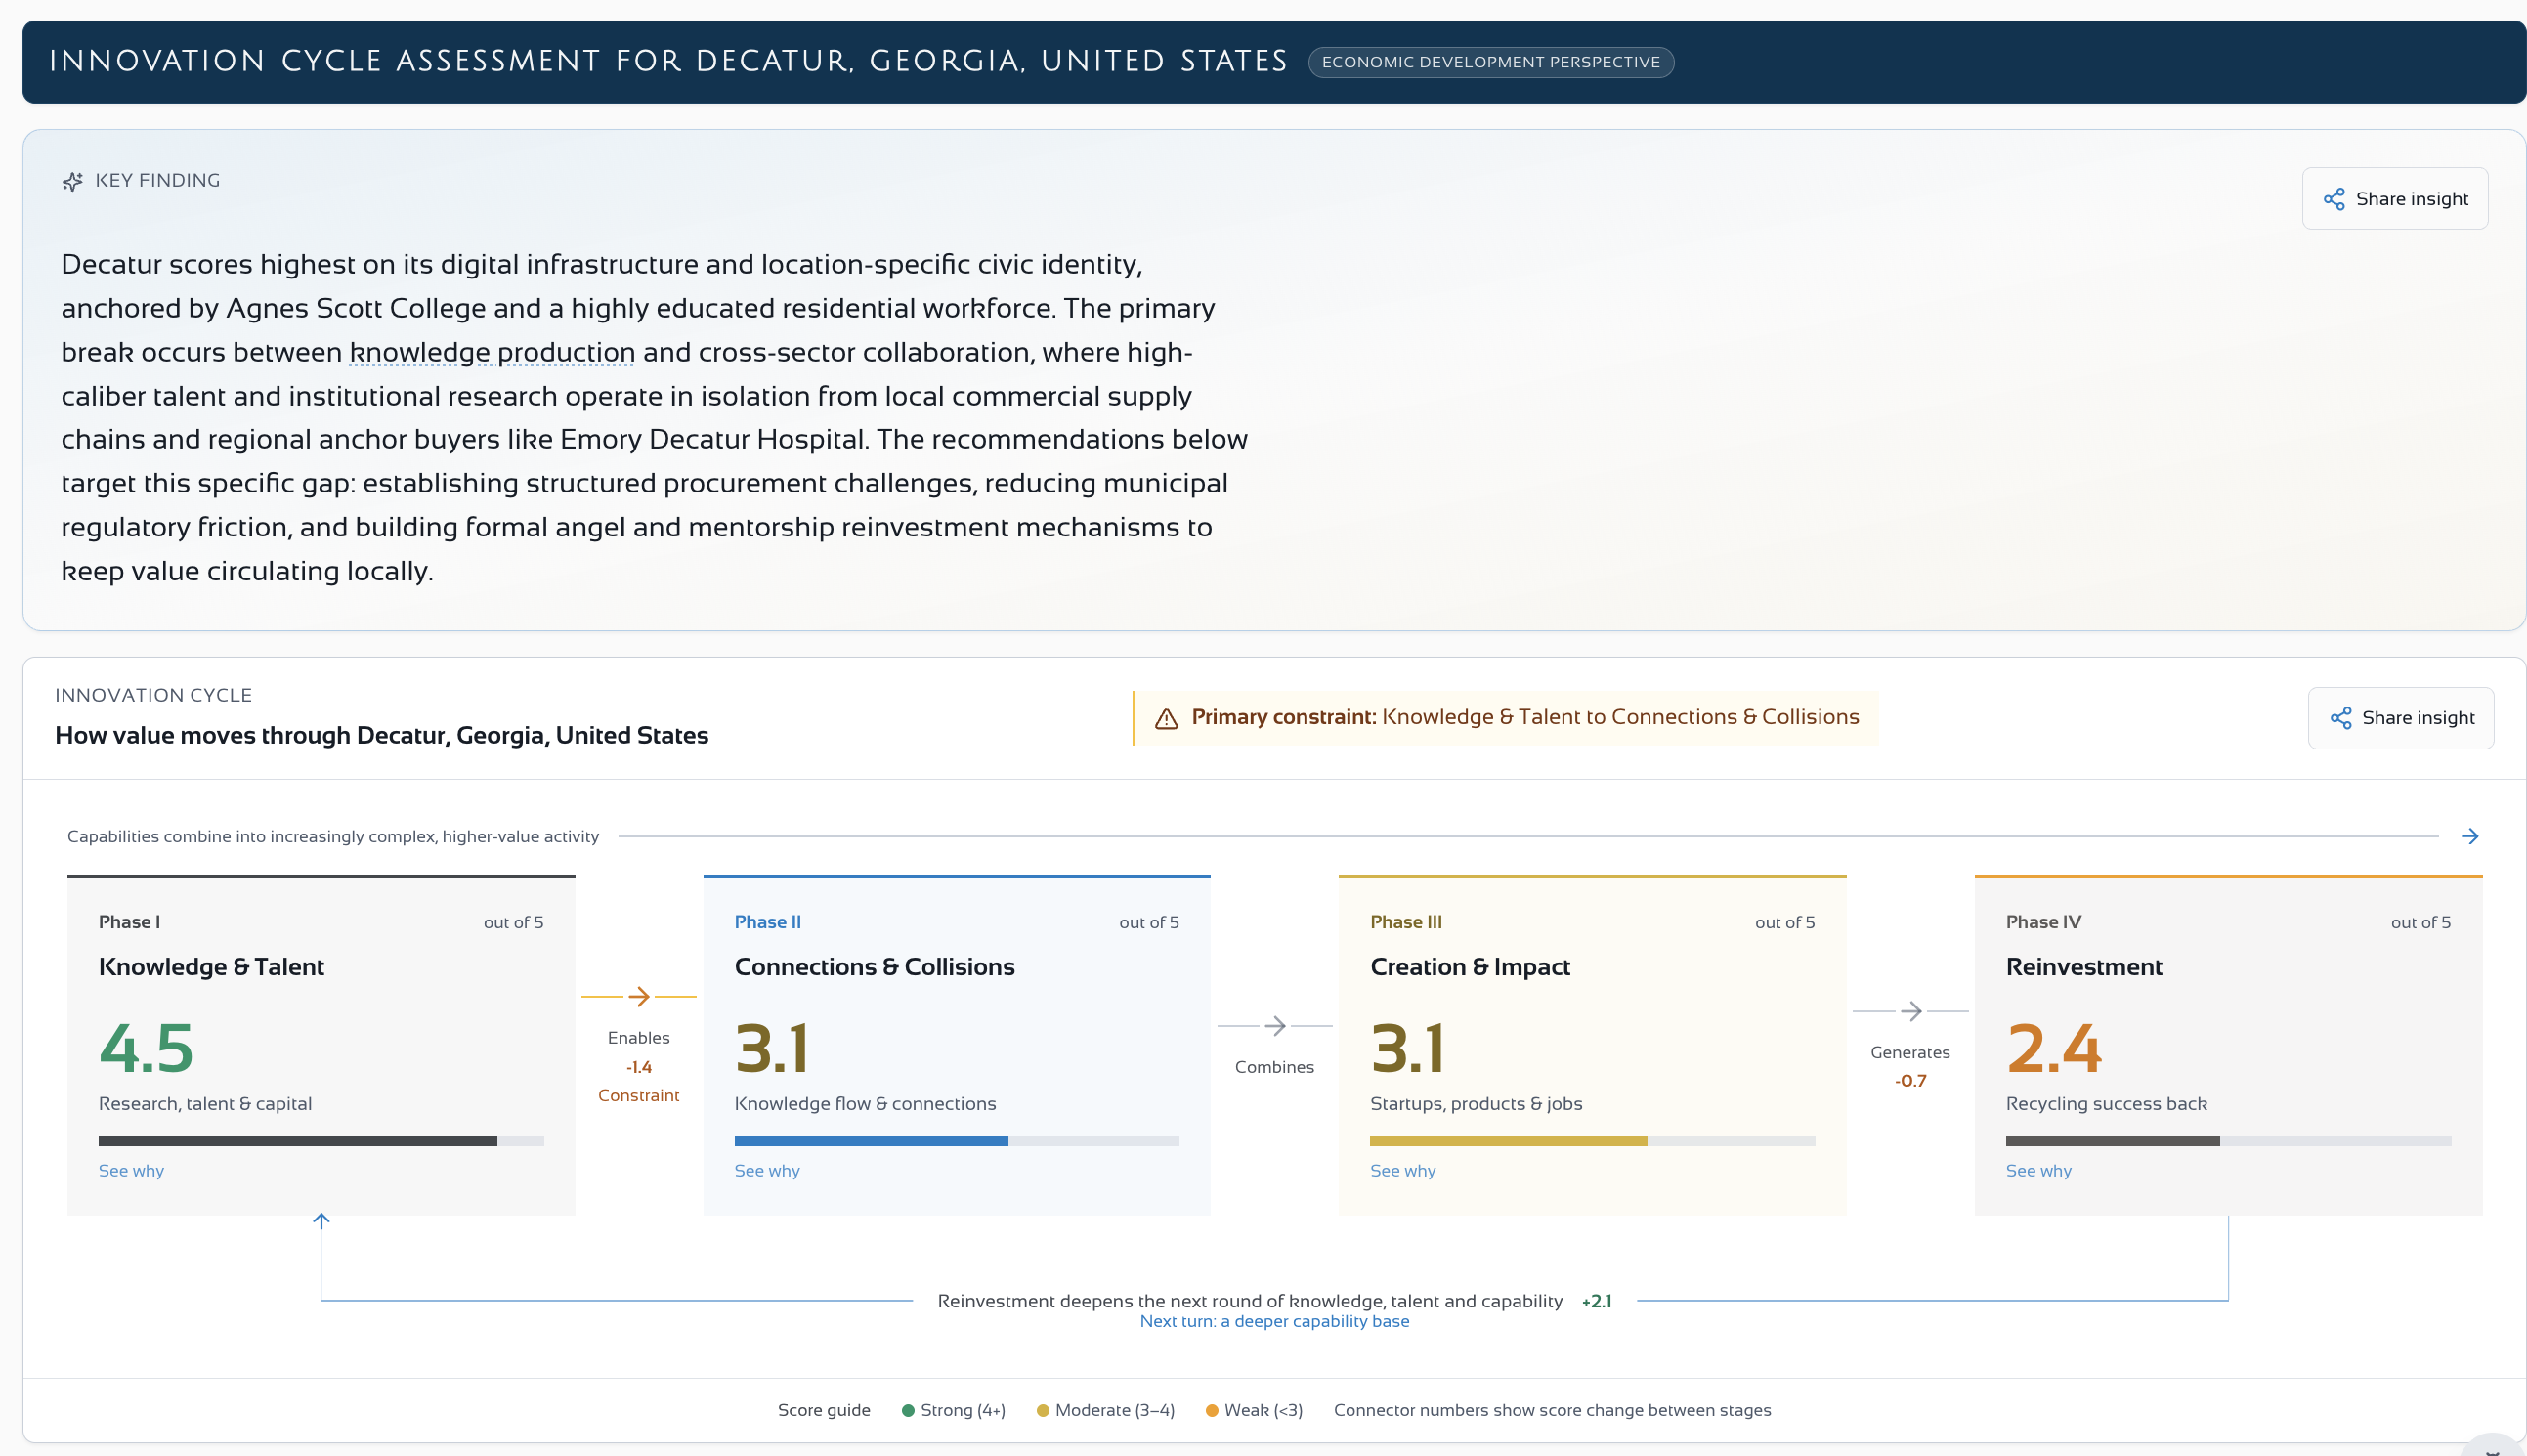
Key finding and cycle scores
The report names the stage where value stops moving and says why.
Common questions from foundations and NGOs
Four questions foundation and development leaders ask about their region, and what the diagnostic can tell you about each one.
"Innovation benefits aren't reaching underserved communities."
The diagnostic asks who takes part in the innovation economy, not only whether it is growing. It shows whether talent pipelines, capital, and knowledge reach a broad population or stay within a narrow group.
"Our workforce programs aren't producing innovation-sector jobs."
Workforce programs need to connect to what local employers actually need. The diagnostic shows whether those on-ramps exist or whether there is a gap between what training produces and what employers hire for.
"Our grants aren't creating systemic change."
Grants fund programs. The diagnostic rates the ecosystem those programs operate in, so you can see whether your funding is reaching root causes or treating symptoms while the underlying gaps stay in place.
"The innovation strategy was written without community input."
Strategies written by a small group tend to leave people out. The diagnostic shows the whole ecosystem, including who takes part and who does not, and gives your organization evidence to argue for a more inclusive approach.
Group diagnostics
Compare how different people rate the same ecosystem
The community and impact view is one part of the picture. Ecosystem Navigator collects it alongside the people who work in the same ecosystem from other roles, then shows the group where they agree, where they differ, and what to look into next.
Diagnose
Run a locally tailored diagnostic from your own role. The free version is 10 questions and takes about five minutes.
Compare
Invite people who work in the ecosystem from other roles, then see where their responses agree and where they differ.
Decide and measure
Investigate the evidence, share clear priorities, and repeat the same exercise to make change visible over time.
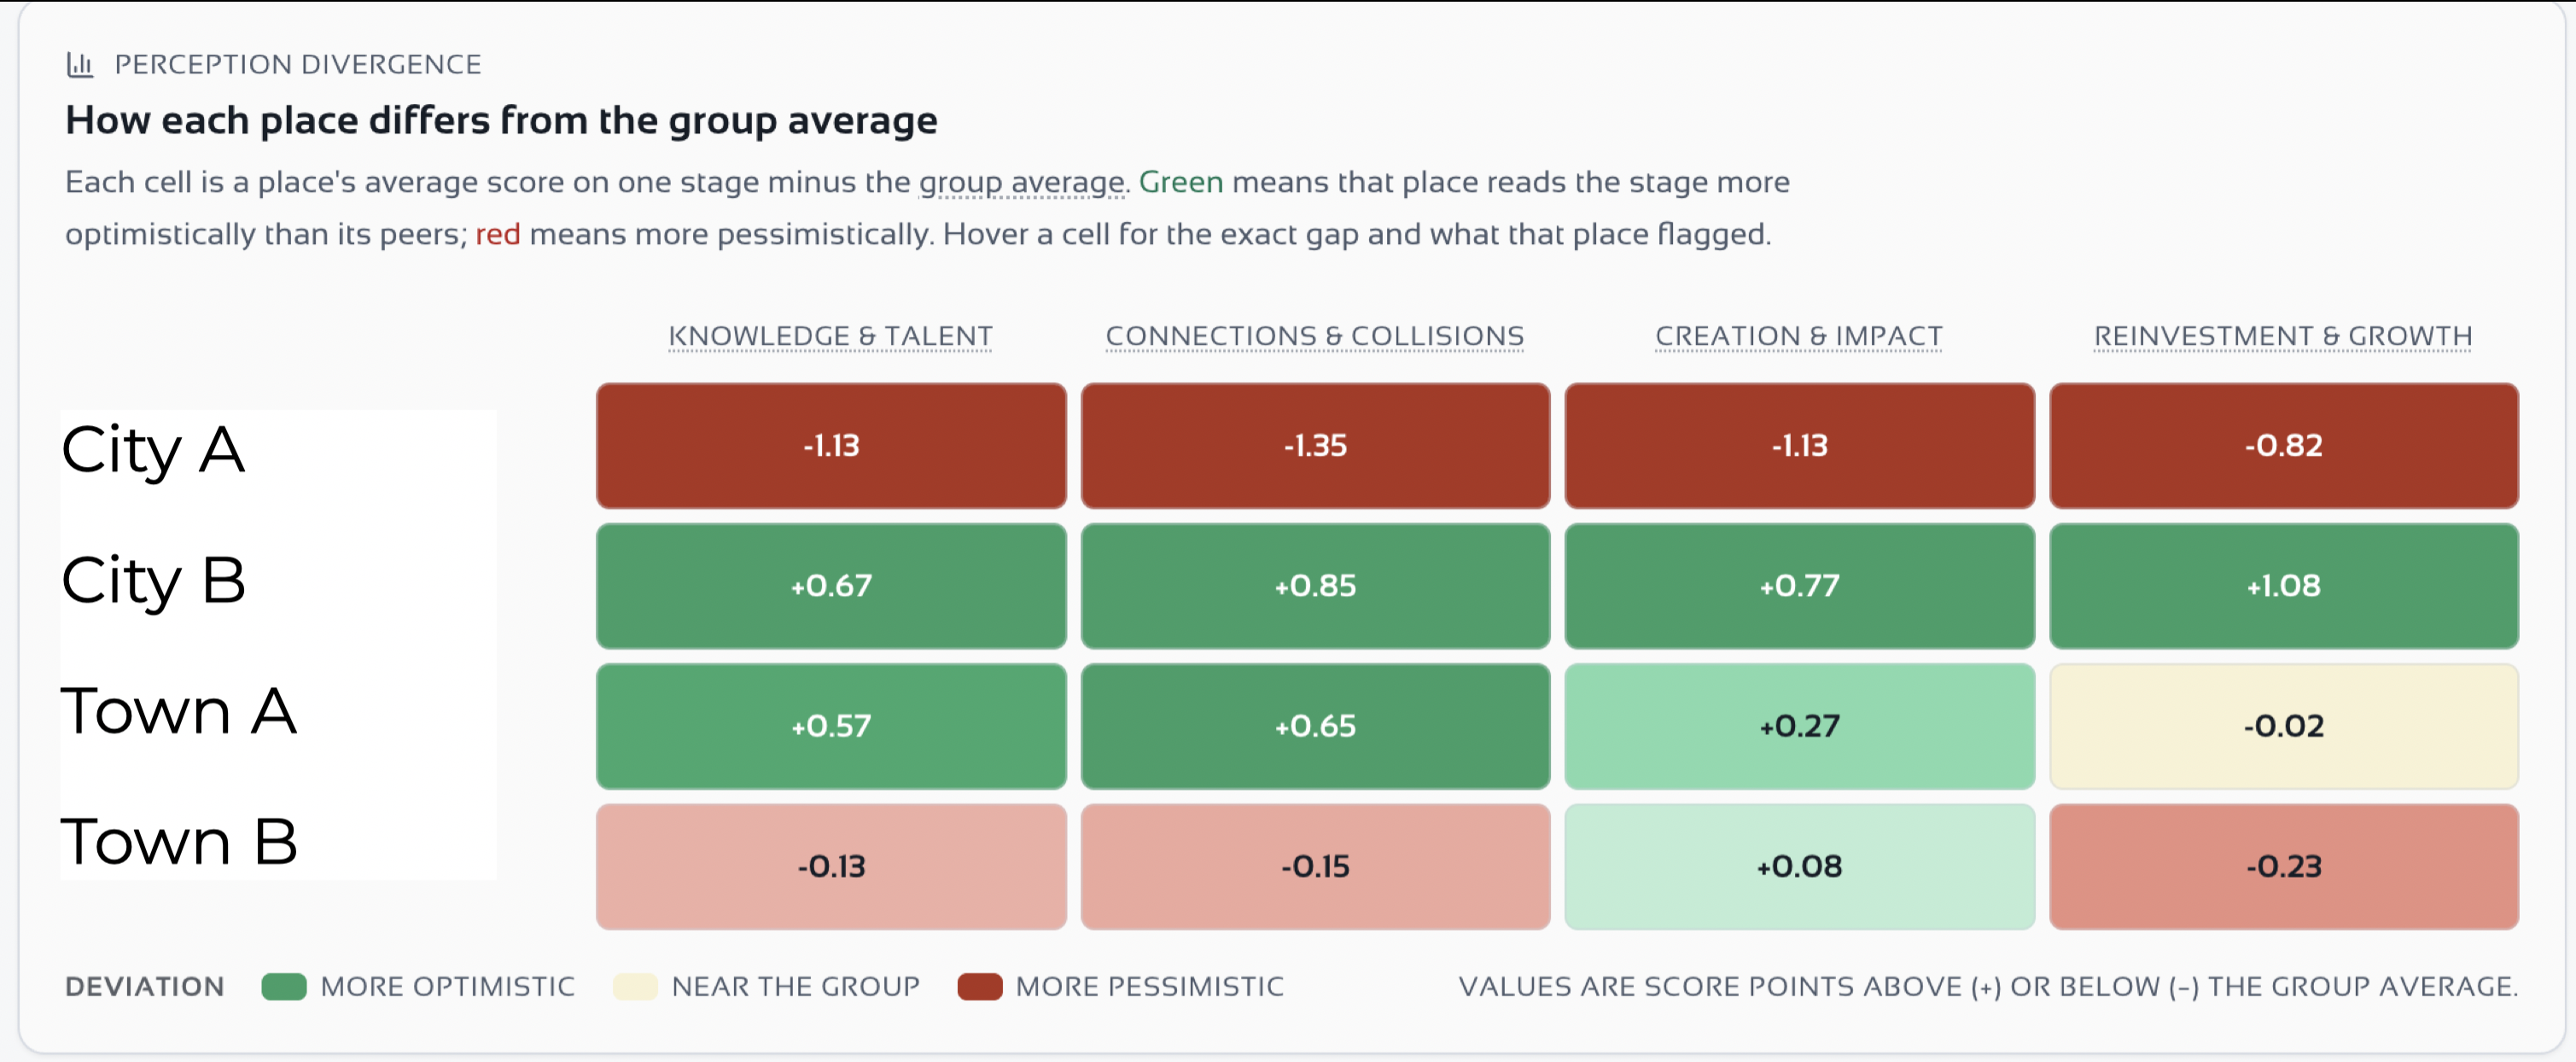
Difference from the group average
Group results in Pro Benchmark. Each row shows where one place or participant rates higher or lower than the rest of the group.
What the platform gives you
Evidence for your board, your funders, and the partners who need to act across the same ecosystem.
A scored baseline on inclusion
Scores for who takes part, who benefits, and where structural barriers limit access to the innovation economy.
Group diagnostics
Compare nonprofit, government, EDO, university, funder, and community views on the same questions.
Evidence base
Each run adds answers, scores, assets, recommendations, and citations to a record of where inclusion gaps persist or improve.
Reports for boards and funders
Shareable reports, PDF export, stakeholder briefs, and priorities for funding, convening, advocacy, and partnership design.
What the report adds to a needs assessment
Needs assessments describe community challenges. The diagnostic assesses the innovation ecosystem behind those challenges and points to where intervention is likely to work.
- Unemployment rate: 7.2%
- Workforce training enrollments: 450
- Small business loans disbursed: $2.1M
- Community programs funded: 12
- “Talent pipelines serve mainly degree-holders. Alternative paths (bootcamps, apprenticeships, micro-credentials) are absent or disconnected from employers.”
- “Innovation economy benefits concentrate in the downtown corridor. Three workforce agencies within 20km are not connected to the accelerator pipeline.”
- “Reinvestment bypasses the community. Successful exits take value out rather than strengthening local capacity.”
Questions from foundation and NGO leaders
We're not an innovation organization. Is this for us?▾
Does this work outside North America?▾
Can I use this in a grant application or funder report?▾
How does this complement our existing needs assessments?▾
What does the free version include?▾
Should our local EDO or government partners run this too?▾
Run the free diagnostic for your region
Ten questions about your region. A report on whether its innovation economy is reaching the communities you serve.
10 questions · About 5 minutes · No account required